9 Ways Dashboards Will Change Your Nonprofit

Communicating and distributing key performance indicators and metrics about your nonprofit to stakeholders can be a manual, time-consuming process. Today, there are a host of accessible tools for nonprofits that can automate dashboarding tasks and make interactive reports resulting in compelling stories. If you’re not using dashboards today, it’s time to consider moving in that direction, and here’s why it’s important.
- Engage donors. Everyone likes a good picture, especially donors. Turning your spreadsheets into an interactive dashboard on your website is a great way to engage funders and communicate important information in a more compelling way.
Create a dynamic annual report. Nonprofits change quickly, so why provide just one report each year? Tell your story through interactive tools that show how you are doing today, not 9 months ago. Here’s an example of our annual report.
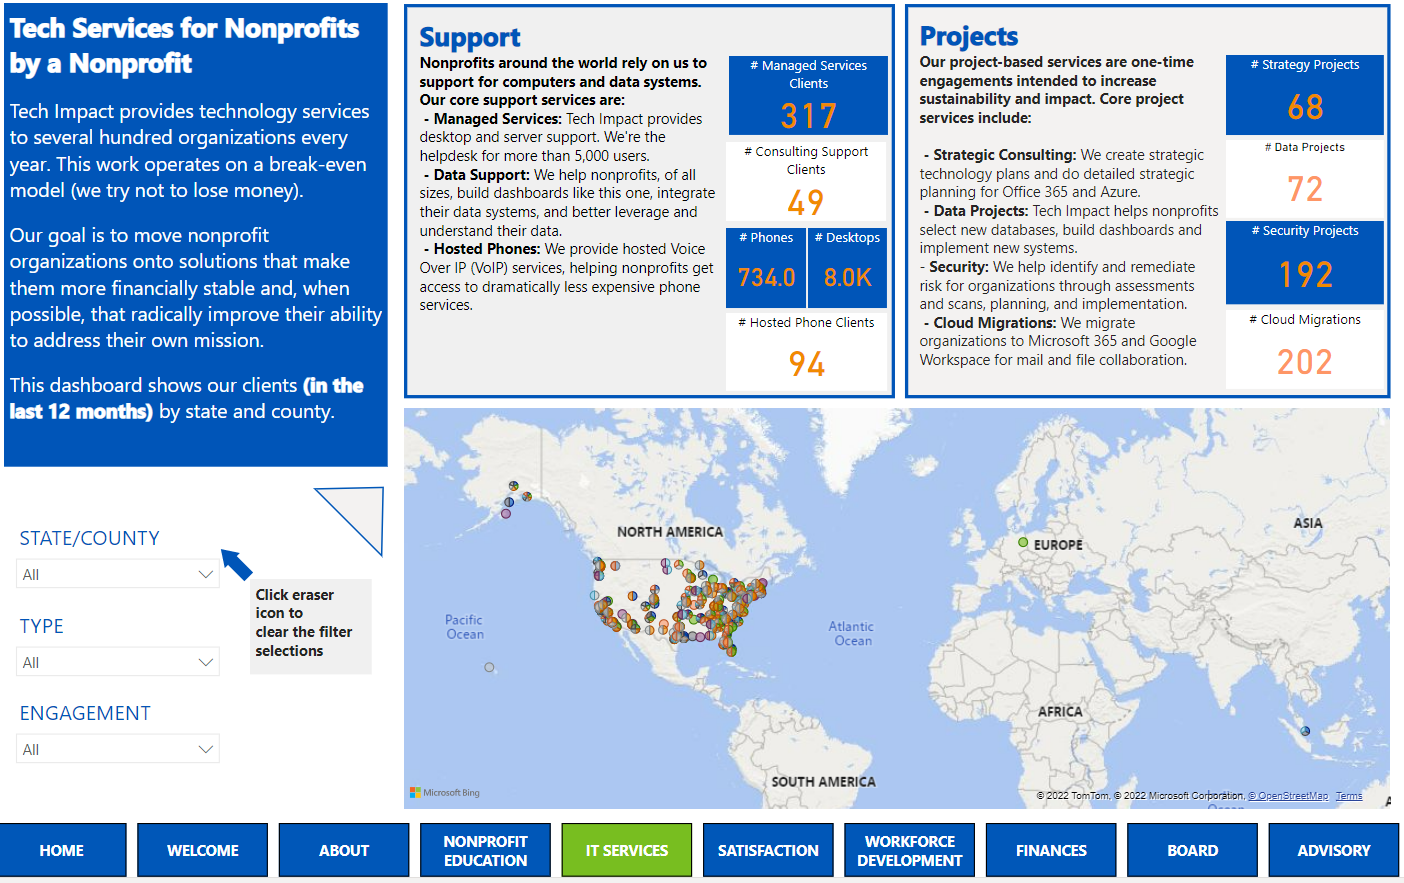
Tech Impact's annual report is accessible via our website and is updated with real-time data so clients, donors and board members can see how we're doing at any time.- Motivate your team. Competition can provide a little incentive to make people really shine. Create dashboards to show the relative impact of different teams in your organization and inspire everyone to do more.
- Report from multiple systems. You don’t need a fancy single system to be able to report on all the work your nonprofit is doing. Dashboards can pull in and combine data from many systems to give you a single source of truth – regardless of how many databases you are required to use.
- Report from mandated systems. Many nonprofits have systems they are required to use. Dashboarding tools allow you to take Excel exports from those systems and turn them into modern, interactive visualizations. Just download the Excel file, put it in a folder, and the rest is done for you!
- Predict staffing needs. Is your nonprofit guilty of the “guess and hope for the best” method of predicting staffing needs? Many are. The good news is that there are dashboarding tools that visually show when your current pace of work won’t be possible with your current staff. This can help you anticipate staffing needs well in advance.
- Empower direct service staff with feedback loops. Most nonprofits make their staff collect data but never show that data to the people doing the work on the ground. Dashboards provide a unique opportunity to show your direct service staff how changes in their work impact clients.
- Be transparent. Show your community the impact of your work in real-time through dashboards on your website. Being honest and transparent about satisfaction and impact is one important way to build buy-in and trust with the communities you serve.
Tell a story. Interactive dashboards hold attention and tell stories better than big blocks of text. Combine anecdotal videos, photos, and audio with interactive dashboards to tell a deep and compelling story.
There are several dashboard options available for nonprofits – Microsoft Power BI and Tableau are two options that provide nonprofit pricing. If your organization is already using Microsoft 365, Power BI may be the best option for you based on the price and functionality. Interested in learning more about how dashboards can change the way your nonprofit works?